I was curious enough to play with D3 (with my own hands! — rare occurrence these days), so I took on a side project to visualize some academic genealogy data from academictree.org. My workflow so far went basically like this:
- Request the data: Huge thank you to Stephen David at academictree.org for providing a CSV dump.
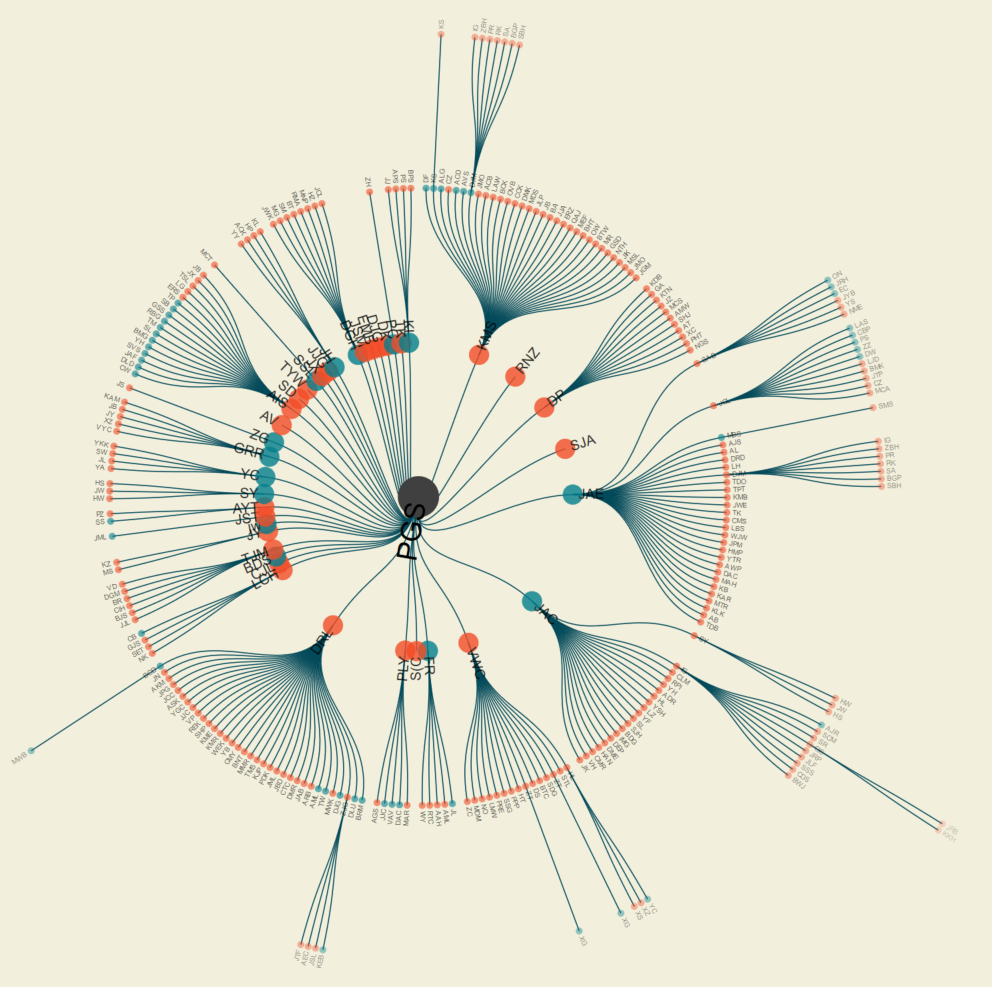
- Pick a visualization from the D3 gallery: I settled on a Radial Reingold–Tilford Tree.
- Write a CSV-to-JSON parser: Needed to emulate the JSON input format for the D3 tree.
- Tweak the styling: Have different colors for postdocs and grad students, change font size to emphasize the central nodes, apply a color palate borrowed from Adobe Color.
And then I ended up with this example tree (centered on this node) (click image to enlarge):
In my ideal world, I’d love to try two things. First, I’d like to vary the color of the edges based on institution or year. Second, I’d like to jitter the radius for each level slightly (for more of a cloud rather than concentric circles). In both cases, I discovered that controlling the formatting of the nodes was much easier than the edges.
But as it is, it doesn’t suck, so I’m putting it out there in this intermediate state… Would love comments, suggestions, or pull requests!
Awesome SciArt!