Recently, someone emailed me to ask how I got the data behind this figure that I often use in the introductions of my talks:
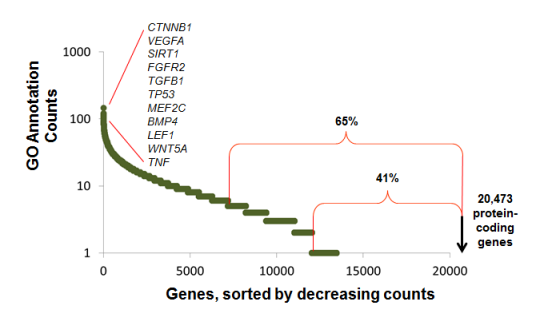
This figure shows that while there are few genes that are very well annotated (100s of GO annotations manually annotated by biocurators), that degree of annotation falls off very quickly. At the time I last did the analysis, 65% of genes had 5 or fewer GO annotations, and 41% had one or zero GO annotations.
To generate the image, I processed the gene2go.gz file at ftp://ftp.ncbi.nih.gov/gene/DATA. The one-liner to do the analysis is here:
wget -qO- "ftp://ftp.ncbi.nih.gov/gene/DATA/gene2go.gz" | gzip -d | awk '$1==9606&&$4!="IEA"{print $2}' | sort | uniq -c | sort -k1nr | less
The first line is the count of GO annotations, and the second column is the Entrez Gene ID. The first ten lines are:
    149 1499

    125 7422

    123 23411

    121 2263

    115 7040

    109 7157

    108 652

    106 4208

    105 153090

    105 348
So the first line says that beta-catenin (with Entrez Gene ID: 1499) had 149 unique GO annotations.
Posting this here in case someone else finds that useful! (And yes, I am a snob about one-liners. awk, sed, sort, uniq, join and tr are every bioinformatician’s friend!)